Inflation Runs Hotter, Hiring Cools | Keeping Connected
October 20, 2026
September delivered a soft jobs report, a hotter CPI print, and firm PMIs on both sides of the Atlantic.
Plus, why quality matters more in credit, what to expect from Q3 earnings, and the case for active fixed income.
Hiring Slows in September While Consumer & Wholesale Prices Surge
• Nonfarm payrolls rose by just 29,000 in September, well below the 84,000 forecast. The unemployment rate increased to 4.2%, though largely due to an influx of members in the labor force. In addition to the weakness in September, the August jobs count was revised lower to reflect a gain of 133,000, while July switched from a gain to a loss, with payrolls falling by 10,000. The revisions in total showed 600,000 fewer jobs than previously reported. Average hourly earnings increased just 0.1% in September, putting the 12-month gain at 3%, the lowest since May 2021.
Most of the monthly job gains came from healthcare, which added 17,000 workers. Construction was up by 11,000, and manufacturing added 9,000. Government employment fell by 17,000.
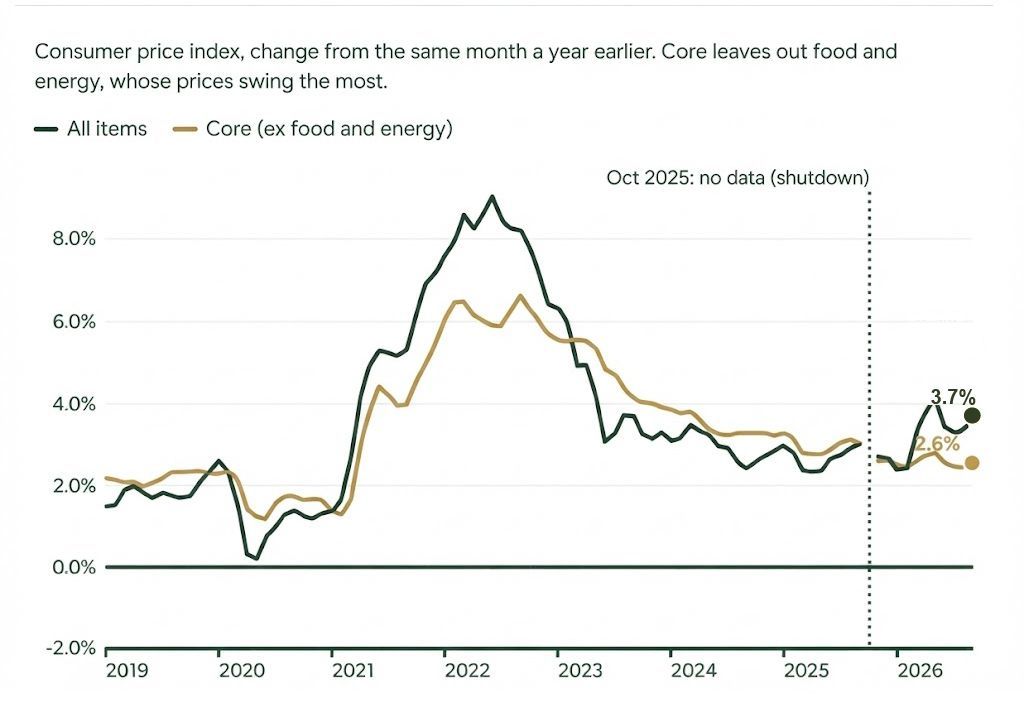
• The September inflation report came in a bit hotter than expected with headline CP| rising by 0.6% M/M or 3.7% Y/Y. Core CPI increased 0.3% M/M or 2.6% Y/Y. Both figures were up from 3.4% and 2.4% in August, respectively. Most of last month's inflation increase is attributable to geopolitical issues and the resulting surge in energy prices. While food inflation was flat M/M, a concerning data point was a 0.4% increase in shelter costs, which have been relatively tame over the past few months. This could signal another uptick in core inflation, likely forcing the Fed into a more hawkish monetary policy response. Wholesale prices surged 6.3% Y/Y in September. Markets are currently pricing in a 39% chance of a rate hike.
Nature's Symphony
Source(s): U.S Bureau of Labor Statistics
PMIs Sit at Solid Levels Across the U.S. & Eurozone
• The manufacturing sector in the U.S. showed flat month-over-month activity in the latest ISM Manufacturing PMI. The headline reading of 54.5 in September was down from 54.6 in August, with strength in new orders, employment, and prices. The production component fell in September, albeit from strong initial levels. The ISM Services PMI fell from 55.4 in August to 54.9 in September, with weakness in new orders and production. Retail sales increased 0.8% in September, well ahead of estimates.
• The eurozone composite PMI hit a 41-month high of 53.1 in September, up from 52.0 in August. Output rose at the fastest pace since April 2023 amid solid expansions in both the services and manufacturing sectors. The latest rise in output was also broad-based across the different geographies. Germany posted an expansion for the third month running, with the rate of growth the fastest in just under a year. Activity increased in France for the first time in 10 months, while the rest of the eurozone registered a solid but softer rise in output. Accelerating business growth is evident in the flash PMI survey, which indicates GDP rising at a quarterly rate of 0.4%, with order book growth picking up further across both manufacturing and services in September, hinting at sustained momentum heading into Q4.
China's Economic Activity May Be Flatlining, May Require a Shot of Stimulus
• The RatingDog China Services PMI rose to 51.6 in September from 51.4 in August, staying above the 50-mark that separates growth from contraction. New business grew at its quickest rate since June, supported by improving demand, while new export orders rose at a faster clip than in August. The employment gauge rose for a fifth straight month, and input costs eased a bit from the prior month. Non-manufacturing PMI also returned to expansionary territory in September, climbing to 50.2. China's official manufacturing PMI rose to 50.1 in September from 49.8 in August. The modest expansion was driven by accelerated activity in equipment- and high-tech-related manufacturing and consumer industries. Essentially, manufacturers have benefited from the AI boom, while domestic demand remains weak.
Higher for Longer = Higher in Quality?
•
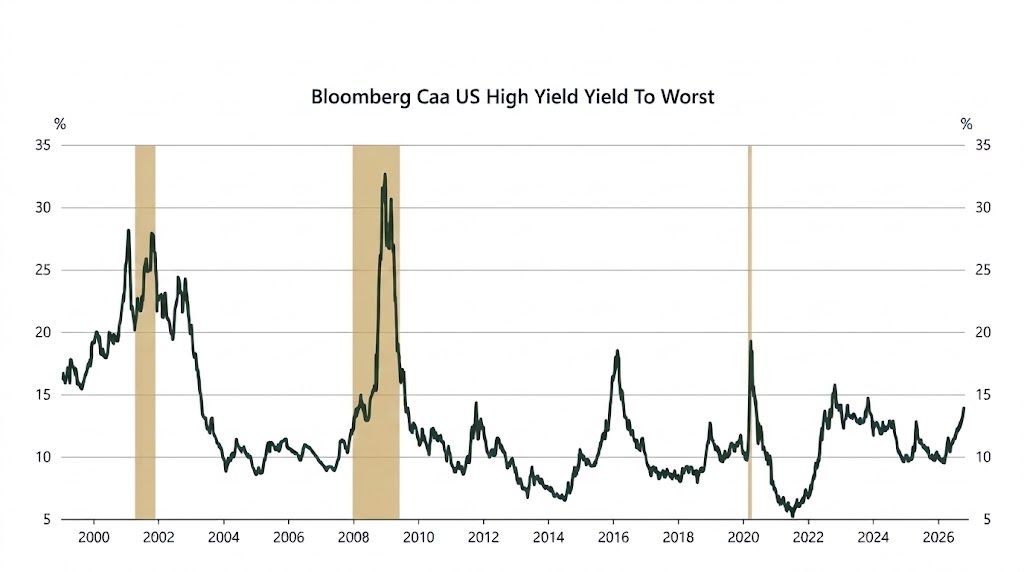
Higher for longer is a slow squeeze for low-quality credit. Every month, rates stay elevated, and more CCC borrowers from the 2021-22 vintages hit the refinancing wall with less cash to service their debt. With CCC yields around 15%, the bill from the cheap-money era is landing on the weakest balance sheets first. The pain is sharpest in heavily levered, PE-backed technology, healthcare, and consumer discretionary names, where floating-rate debt, thin margins, and AI-disruption risk leave little room to absorb years of elevated borrowing costs. Strong balance sheets locked in cheap fixed-rate debt and have barely felt the Fed's tightening, while the most leveraged borrowers feel it in full as floating-rate costs and maturities reset. The message is to move up in quality and to invest in companies with earnings that can pay their higher debt-servicing costs.
Nature's Symphony
Source(s): Bloomberg, Macroband, Apollo
Q3 Earnings Growth Expected to be Very Strong Again, Led by Energy & Tech
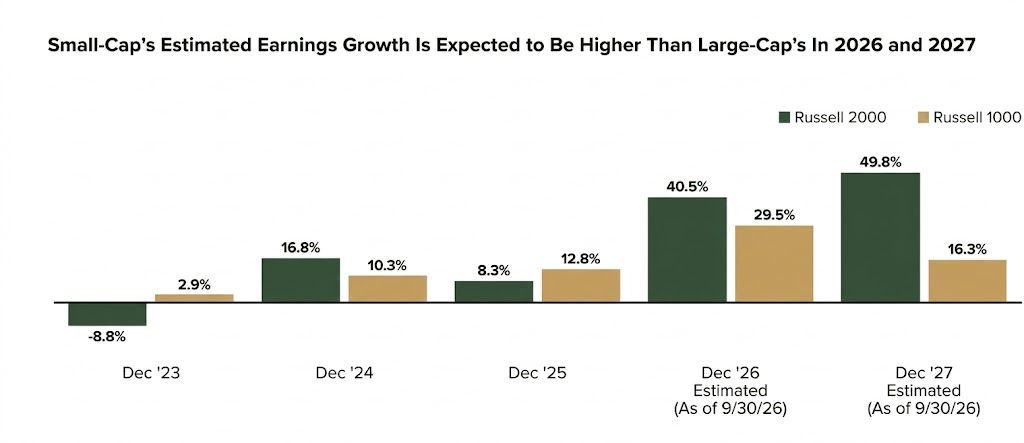
• As we enter the Q3 earnings season, investors will be looking for additional color on growth and spending for the Al thematic trade and the underlying hyperscalers. The analyst community expects ~30% Y/Y earnings growth in Q3, the third straight quarter of more than 25% EPS growth. Energy, tech, and communication services are projected to report the highest Y/Y EPS growth in Q3, with financials and consumer staples bringing up the rear at around 3% growth. Analysts expect 32.7% earnings growth for calendar year 2026 and 15.8% for 2027, with earnings growth likely to be driven by tech. It is important to note that the small-cap Russell 2000 Index is forecast to report 40.5% EPS growth for 2026 and 498.8% for 2027.
Active Management in Fixed Income Remains Crucial Given the Significant Challenges
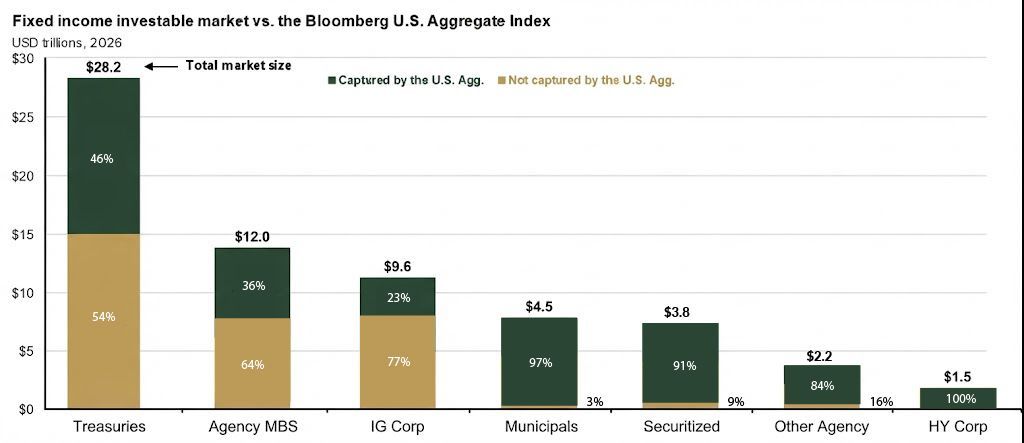
• We continue to pound the table on the importance of employing active management in fixed-income markets. The U.S. opportunity set for credit and Treasuries is enormous, but only a small percentage of securities are included in the well-known Bloomberg Aggregate Index. Examples include 46% of the Treasury market not being included in the Agg Index and 91% of the securitized market. The total market size of the Treasury market is $28.2T, and it is $3.8T for the securitized market. Fixed income managers have many more levers to pull when managing a fixed income portfolio than with the Bloomberg Agg benchmark. In addition to decisions regarding duration and yield/income, credit sector exposure is crucial, as are active share and security selection. A high-conviction thesis on core fixed income starts with the principal protection it provides, but is more compelling today given higher starting yields. We believe that fixed income is one of the few remaining asset classes that consistently delivers alpha from active management.
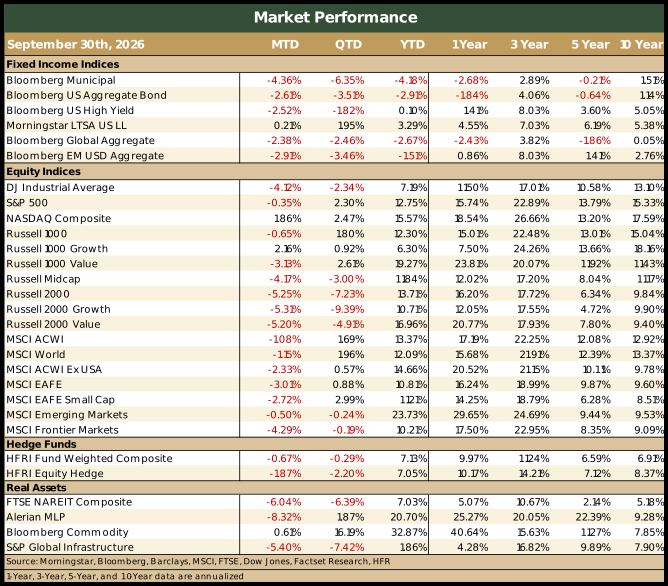
Market Review
- U.S. equities performed well, all things considered, on a relative basis. Growth stocks and the Nasdaq generally led the way, driven by renewed interest in the Al trade.
- Small caps struggled in September while growth stocks outpaced value stocks within large caps. Style mattered less within small caps.
- Despite the September challenges, U.S. equities have still generated solid performance for the 4th straight year.
- Equities outside the U.S. were weak last month as equities sold off and the USD strengthened. Unlike what occurred in the U.S., small caps beat large caps, and value stocks outperformed growth stocks.
- EMs fell in value due to weakness in China. USD strength cost EAFE investors 135 bps last month and EM investors 18 bps. Interest rates spiked higher again in September, leading to outsized losses across all areas of fixed income except floating-rate loans. Core fixed income and muni bonds were hit hard.
- Credit markets experienced spread widening amid concerns over massive hyperscaler debt issuance.
- Bonds outside the U.S. also faced the added headwind of the stronger U.S. dollar.
- Hedge funds broadly fell last month, driven by weakness in more equity-sensitive strategies like equity L/S and event- driven. Relative value fell 1.1%, but macro funds gained 2.7%.
- Real assets exhibited weakness in September with REITs, MLPs, and listed infrastructure all losing ground. Commodities rallied with higher energy prices.
- 2026 has been another remarkable year for risk assets, but concerns are mounting about higher interest rates and their potential impact on equities and fixed-income markets.
Note: For informational purposes only. Not an investment recommendation. The views expressed are those of Meramec Financial Planners LLC's advisory representatives as of the date of this newsletter. Opinions and any forward-looking statements expressed in this newsletter are subject to change without notice and are not guarantees of future performance. Historical performance figures for the indices are provided for illustrative purposes only and do not represent any actual investments. Index performance assumes reinvestment of distributions. The Indices are unmanaged, and you cannot invest directly in an index. Past performance is no guarantee of future results. Diversification does not assure or guarantee better performance and cannot eliminate the risk of investment losses.