Heating Up | Keeping Connected
June 12, 2026
Summer has arrived…and so has the heat. Inflation is running at its fastest pace in three years, energy prices have surged 23.5% over the past twelve months, geopolitical tensions continue to simmer following the outbreak of the conflict in Iran, and volatility across interest rates and currencies remains firmly elevated. Yet, just as scorching day rarely slows a determined market, financial markets have largely shrugged off the discomfort.
U.S. equities powered higher in May, the S&P 500 posting a gain of 5.26% on the month and 29.78% over the trailing year, fueled by a first-quarter earnings season that delivered a stunning 28.8% growth rate for the index – more than double what analysts had anticipated.
Corporate America is running hot in the best sense of the word, AI-driven capital investment is surging, and the global growth picture, while uneven, is adding fuel to the fire.
Europe is feeling the burn most acutely, with the eurozone's composite PMI sinking to a 31-month low in May and economists forecasting a 0.2% contraction in Q2, as rising prices weigh on production, hiring, and consumer confidence across France and Germany alike. Japan, by contrast, is finding its footing, with Q1 GDP expanding to an annualized 2.1% on the back of stronger consumption and an 11.5% surge in exports, though higher energy costs tied to the Iran conflict remain a meaningful headwind for the country's corporate sector.
Elsewhere in emerging markets, India delivered a standout 7.8% GDP growth print in Q1, well ahead of forecasts, while Brazil posted a solid rebound driven by stronger investment and consumer spending – both nations demonstrating that the EM growth engine still has plenty of heat left in it, even as inflation keeps central banks on their toes.
The economy, the markets, and the geopolitical backdrop are all, in their own ways, heating up – and navigating the heat with patience and strategic diversification remains, as always, a guiding principle.
Economic Backdrop Remains Solid in Spite of Higher Inflation & Geopolitical Uncertainty
U.S. employers added a better-than-expected 178,000 new jobs to the economy in March, well ahead of the 59,000 estimate. February's number was revised down by 41,000, while January was revised up by 34,000 to 160,000, putting the 3-month average around 68,000.
The unemployment rate edged lower to 4.3%, though that was largely due to a sharp reduction in the labor force (the labor participation rate fell to 61.9%).
Wages also rose less than expected, with average hourly earnings up just 0.2% for the month and 3.5% from a year ago. Economists had expected respective readings of 0.3% and 3.7%. As has been the case, health care was responsible for much of the growth, adding 76,000 jobs.
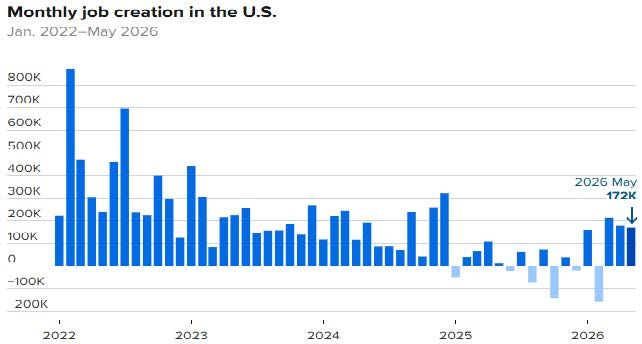
The May employment report beat expectations with upward revisions to the prior months' reports. The headline reading of 172,000 new jobs was well ahead of the 80,000 expectation, and the March and April reports saw total upward revisions of 93,000. The unemployment rate held steady at 4.3%, and the broader U6 unemployment rate declined to 8.1%.
Average hourly earnings increased 0.3% M/M and 3.4% Y/Y. Leisure and hospitality led all sectors with 70,000 jobs, well above the 14,000-per-month average over the past year. Health care, which has been the leading sector, contributed 35,000 new hires, about in line with its average. Local government added 55,000, and social assistance added 12,000. Broader economic growth has been solid, with 3% growth expected in Q2.
U.S. GDP expanded at an annualized clip of 1.6% based on the second reading from the Bureau of Economic Analysis. This was down from the initial reading of 2%, but up from Q4's 0.5% pace. Gross private domestic investment surged, bolstered by an unrevised 17.2% jump in equipment spending. This continued capital influx was heavily anchored in AI -related infrastructure and software.
Personal consumption expanded at a revised 1.4% rate, a deceleration from previous quarters as elevated gas prices and lower savings rates squeezed household budgets. The initial reading was cut because of downward revisions to consumer spending and investment.
U.S. consumer prices rose at their fastest pace in 3 years based on the May CPI report. Headline inflation increased 0.5% M/M or 4.2% Y/Y while Core CPI registered a gain of 0.2% M/M or 2.9% Y/Y. Most of the inflation surge came from a 3.9% jump in energy prices, putting the 12 -month increase at 23.5%. Food accelerated just 0.2%, and shelter costs rose 0.3%, half the gain of April. The Fed’s preferred PCE Index showed headline inflation of 3.8% in April, with core inflation at 3.3%.
Nature's Symphony
Source(s): U.S Energy Information Administration
Consumers & Businesses Are Holding Up
U.S. retail sales rose 0.5% M/M in April, following an upwardly revised 1.6% gain in March. Retail spending was up across most categories last month, but it was down at furniture stores (-2%), car dealerships (-0.5%), department stores (-3.2%), and clothing shops (-1.5%).
Meanwhile, sales at gas stations rose just 2.8% in April, down sharply from March's steep 13.7% increase, which brought down the headline figure. Overall, we believe U.S. consumers remain resilient despite soaring gas prices. Core retail sales increased 0.5% M/M in April.
April durable goods orders surged 7.9%, chalking up the largest increase in nearly a year. The result exceeded expectations, rising by 4%. March orders were revised higher, to 1.3% from 0.8%. Excluding transportation, orders advanced 1.1%, the same as in March.
Transportation orders jumped 21.5%, led by a 166% rise in civilian aircraft orders. Boeing booked orders of 136 new planes in April, a sharp increase from 33 in the prior month. Gains in durable goods orders were broad-based, with nearly all industries reporting increases.
The one exception was computers and electronic product orders, which declined 0.7% after seven straight months of gains. Nondefense capital goods orders excluding aircraft, a proxy for capital spending, fell 1.1%, after rising 3.9% in March and 1.6% in February.
Eurozone Economy Shows Weakness, While Japan Posts Growth in Q1
The eurozone flash composite PMI fell to its lowest level in 31 months, to 47.5 in May (down from 48.8 in April). Services activity dropped to a 63 -month low in May, and the rebound in manufacturing activity weakened a bit to a 3 -month low. Prices rose at their fastest pace in 3.5 years, leading to weakness in production, new orders, and employment. Both France and Germany reported declines in business activity last month. Based on May's PMI data, economists expect the eurozone economy to contract by 0.2% in Q2.
Japan's economy grew at an annualized 2.1% in Q1 of 2026, beating expectations on the back of improved consumption and strong exports. Japan's exports grew by a better -than -expected 11.5% Y/Y in March, partly powered by a 29.3% jump in shipments of semiconductor equipment. The BOJ recently cut its 2026 GDP growth forecast and raised its inflation outlook. As a major energy importer, the war in Iran (and the Middle East at large) is significantly affecting corporate profits and household incomes.
India & Brazil Are Driving EM Growth
India's economic growth surged 7.8% in Q1, well ahead of the 7.2% forecast. India benefited from trade deals with the eurozone in Q1, along with some U.S. tariff relief. As a major energy importer, India's economy is expected to feel the pain of higher oil prices resulting from the war in Iran.
While inflation remains below the RBI 4% target, the central bank recently raised its inflation forecast to 5.1%. They also lowered their GDP growth forecast to 6.6% from 6.9%. Brazil's economy rebounded in Q1 with GDP growth of 1.1% Q/Q, supported by stronger investment and consumer spending.
Consumer spending rose 1% while investment increased 3.5%. Brazil’s economy is forecast to grow 2 -2.5% this year, but like most countries, inflation remains above the central bank’s 3% target, creating a challenge for future monetary policy.
Nature's Symphony
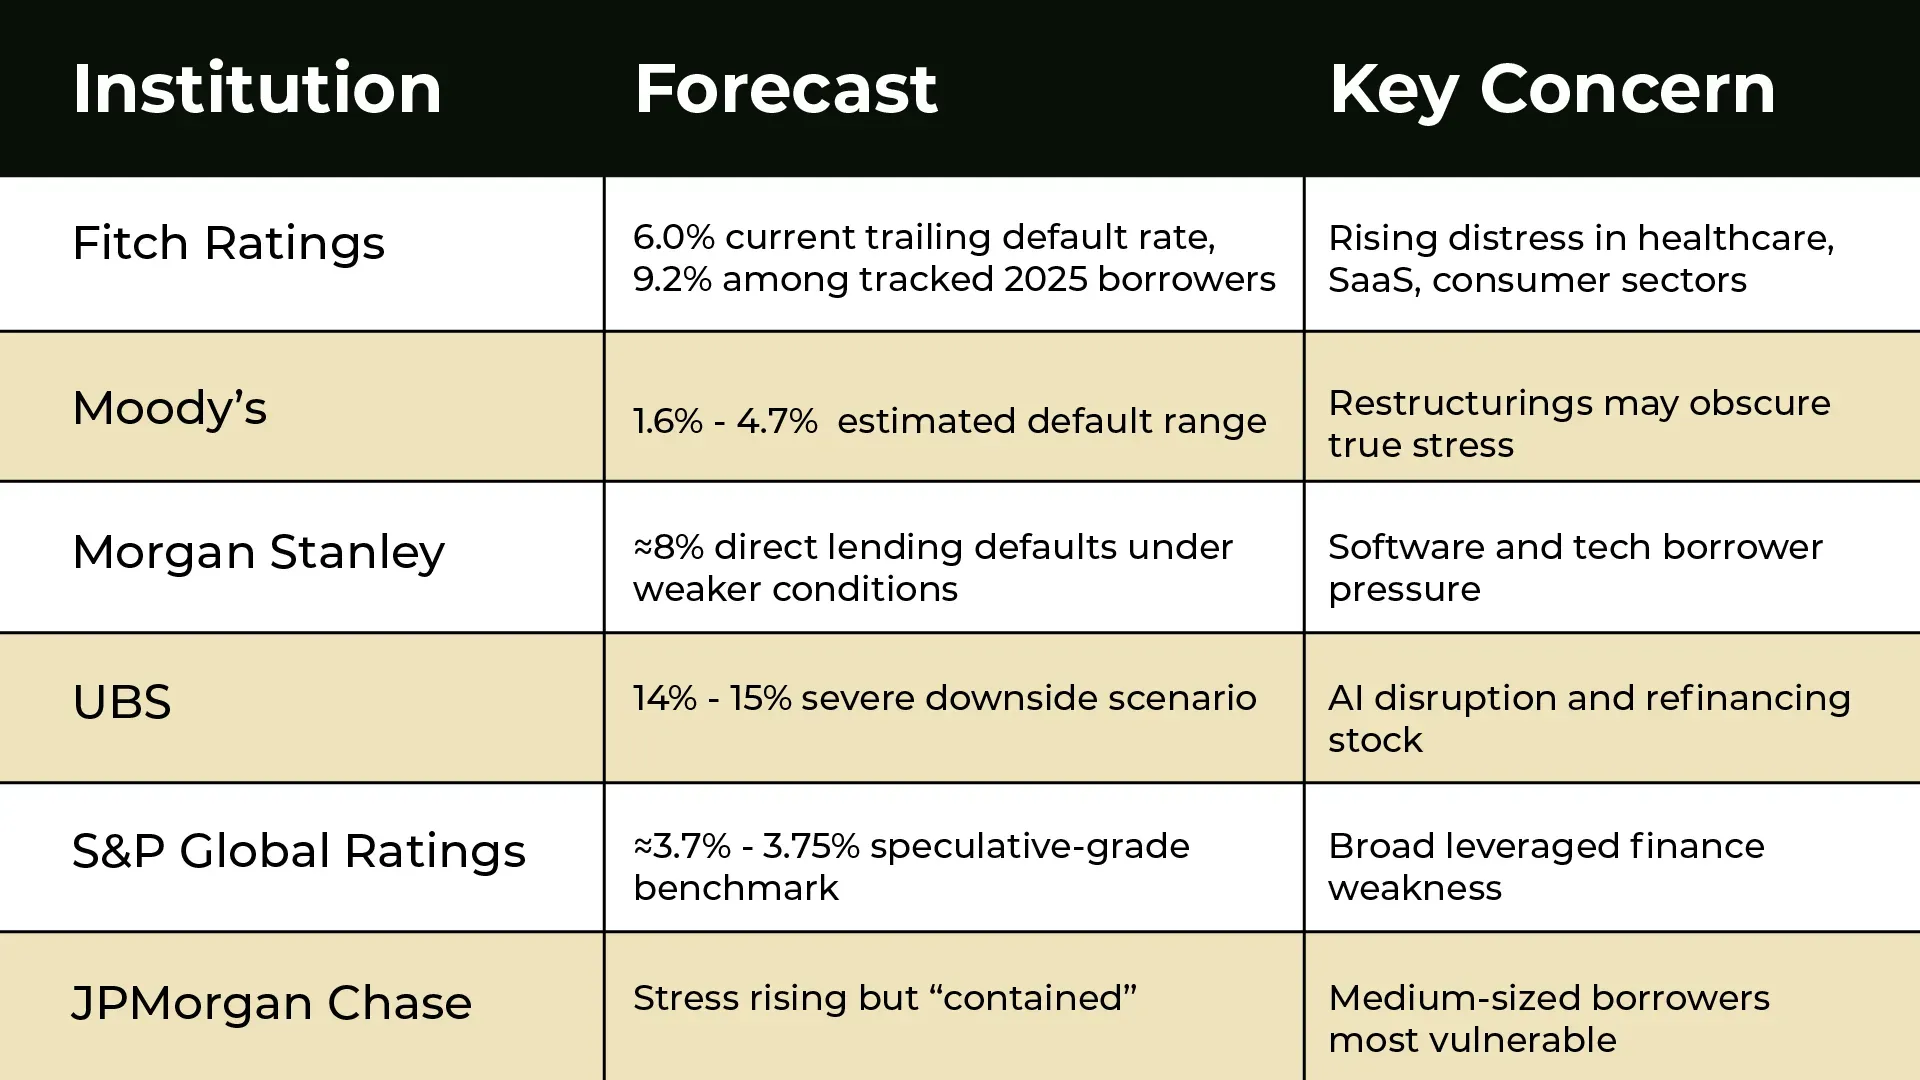
Source(s): Rating Agencies' and Lending Banks' Default Forecasts
How Much Longer Will Private Credit Stress Last
Perceived stress in private credit markets persisted into Q2, with notable interval funds and BDCs reporting redemption queues exceeding the stated 5% quarterly requirement. Blackstone's BCRED fund reported redemptions of 10% ($4.4B) for Q2, but the firm will restrict those to just 5%, meaning exiting investors will receive a pro -rata redemption.
Cliffwater’s flagship Corporate Lending Fund incurred redemptions of 17% of NAV, higher than the 14% rate reported in Q1. Cliffwater also plans to cap redemptions at 5% in Q2. While other notable firms are still compiling their redemption data, Partners Group and Blue Owl have reported similar figures.
Blackstone said that BCRED remains well-capitalized, with more than $15B in available liquidity and repayments exceeding shares repurchased. Loan repayments of $2.6B received in the first quarter and about $1B of inflows in the second quarter have more than outpaced share repurchases
Earnings, Earnings, Earnings!
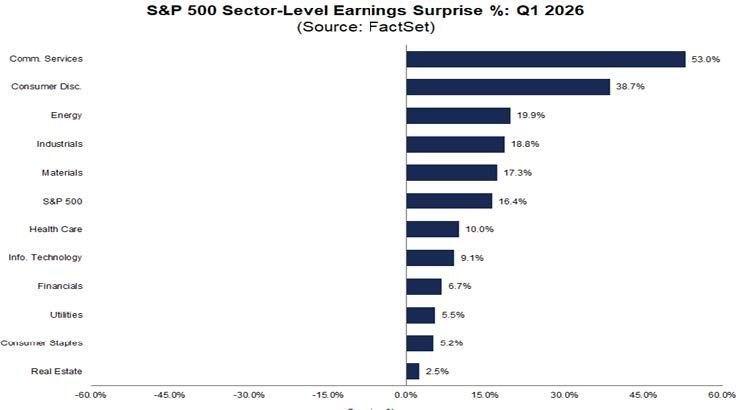
Corporate America has ignored the geopolitical noise that often impacts financial markets and risk assets. Q1 earnings in the U.S. were nothing short of spectacular, with growth coming in at 28.8% for the S&P 500. This was more than double analyst expectations and driven by huge earnings beats from the AI/disruptive technology theme.
Analysts project 22.8% earnings growth in 2026, with all four quarters expected to top 20%. In addition to the strong results expected this year from communication services and technology, the S&P 500 should get a boost from energy and materials due to higher energy/commodity prices.
Earnings have provided substantial support for current valuations, and we think the ingredients are in place for further gains in risk assets, assuming there are no additional unanticipated shocks.
Volatility Remains High
Volatility in interest rates and currencies continued in May and early June, with the 10-year Treasury yield rising above 4.5% and the USD strengthening against most major currencies. We expect volatility to remain elevated globally due to geopolitical uncertainty and conflicting statements from the Trump administration. This dynamic has presented significant challenges for active management.
Market Review
- U.S. equities posted strong gains in May, driven by strength in growth/tech stocks and the broader AI theme.
- Large caps outperformed small caps last month, and value stocks underperformed growth stocks across all market caps.
- The tech-heavy NASDAQ was the best-performing U.S. index last month. Earnings remain supportive of current U.S. equity valuations.
- EAFE equities performed well in May, but lagged U.S. equities. EM equities posted an exceptional 9.7% gain.
- Within non-U.S. equities, growth outpaced value, but unlike what occurred in the U.S., small caps beat large caps.
- U.S. dollar strength hurt EAFE returns by 62 bps in May. EM currencies held up better against the USD, leading to little dispersion between local and USD returns.
- Core fixed income and municipal bonds got a boost from lower Treasury and other sovereign debt yields in May.
- Credit spreads modestly tightened last month, leading to another positive month of clipping coupons.
- Bonds outside the U.S. posted modest gains in May but were held back a bit by the stronger U.S. dollar.
- Hedge funds broadly gained 1.7% in May, fueled by gains in equity L/S, event-driven, and relative value strategies. Macro funds were largely flat last month.
- Real assets were negative across the board last month, led by weakness in commodities, MLPs, and listed infrastructure.
- May was another strong month for financial markets and risk assets worldwide. While volatility and geopolitical uncertainty remain quite high, corporate earnings continue to deliver better-than-expected results, and this has ultimately driven stock prices higher. As always, we preach patience and strategic diversification.

Note: For informational purposes only. Not an investment recommendation. The views expressed are those of Meramec Financial Planners LLC's advisory representatives as of the date of this newsletter. Opinions and any forward-looking statements expressed in this newsletter are subject to change without notice and are not guarantees of future performance. Historical performance figures for the indices are provided for illustrative purposes only and do not represent any actual investments. Index performance assumes reinvestment of distributions. The Indices are unmanaged, and you cannot invest directly in an index. Past performance is no guarantee of future results. Diversification does not assure or guarantee better performance and cannot eliminate the risk of investment losses.