Extra Time | Keeping Connected
July 14, 2026
The U.S. Economy's Summer Showcase
With the World Cup having lit up American stadiums this summer, the U.S. economy has been putting in a similarly mixed performance on the field — flashes of brilliance mixed with a few uncharacteristic turnovers.
June's labor market report came in soft, with just 57,000 jobs added and sizable downward revisions to prior months, though the unemployment rate held steady at 4.2%. Inflation, meanwhile, cooled more than expected as energy prices eased.
Retail sales got a boost from World Cup tourists filling seats and wallets alike, even as spending elsewhere showed some fatigue. Fans from around the globe flocked to see firsthand why so many consider America the greatest country on earth, and their spending helped carry consumer activity through the month.
Behind the scenes, though, private credit had a rougher go of it, as retail-driven redemptions accelerated across BDC and interval funds in the second quarter, even as institutional investors viewed the pullback as a buying opportunity.
Abroad, the eurozone looked like a squad finally finding its footing after a rough stretch, while Taiwan and South Korea continued their run as breakout stars in the emerging-markets tournament, riding the global AI investment wave.
Just as anticipation had built for the tournament's final rounds, markets are gearing up for their own high-stakes matchup: Q2 earnings season, where the S&P 500 is expected to deliver full-year profit growth near 25%.
Still, with geopolitical tensions in the Middle East threatening to disrupt the run of play through energy price volatility, investors will want to keep an eye on the clock as we head into the back half of the year.
Labor Markets Are Hanging In, While Inflation Cools More Than Anticipated
• Job growth in the U.S. slowed slightly in June, with only 57,000 new jobs added to the economy, below the expected 115,000. The unemployment rate, however, dropped to 4.2%, largely due to a slump in the labor force participation rate, which fell 0.3 percentage points to 61.5%, the lowest since March 2021.
Prior months also saw significant downward revisions — the May total, which had been much stronger than economists had anticipated, was cut by 43,000, while April's figure fell by 31,000 to 148,000, indicating labor market growth was significantly slower than previously thought.
Professional and business services contributed the most, with a gain of 36,000. Social assistance added 25,000, and healthcare employment rose by 22,000. Finally, wages grew 0.3% M/M or 3.5% Y/Y.
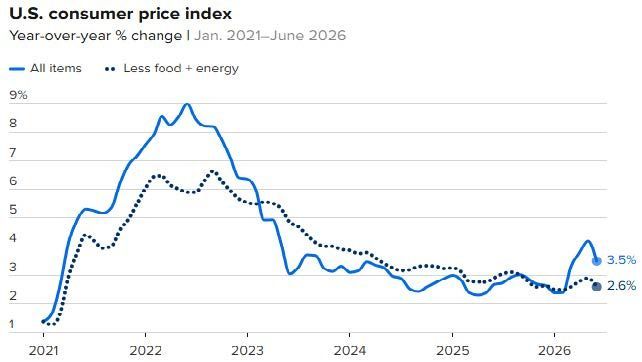
Consumer prices rose 3.5% annually in June, less than expected, as energy prices eased to near pre -war levels. The June CPI report showed headline inflation fell 0.4% M/M, but rose 3.5% Y/Y, while core CPI was flat M/M but increased at an annual clip of 2.6%.
The easing of prices came from a big decline in energy and a decrease in service costs, particularly for housing. Energy declined 5.7% M/M but has still gained more than 15% Y/Y. Food prices jumped 0.2% in June, and shelter costs increased just 0.1%.
The Fed's preferred inflation gauge, the PCE Index, showed annual increases of 4.1% on headline inflation and 3.4% for core PCE.
We believe the Fed will remain patient with any future monetary action until there is more clarity on the Iran conflict and energy prices. It is important to note that energy prices are rising again amid renewed strikes in the Middle East.
Nature's Symphony
Source(s): U.S. Bureau of Labor Statistics
Retail Sales Get World Cup Boost & PMIs Continue to Show Resilience in U.S.
Spending at U.S. retailers last month was weaker than expected, despite the World Cup drawing tourists from around the world and online sales events.
Retail sales rose 0.2% in June from the prior month, down sharply from May’s revised 1% increase. Excluding sales at gas stations, spending rose a solid 0.7% in June. Overall spending was buoyed by the World Cup and Amazon’s Prime Day, although spending at gas stations declined 5.3%.
Consumers remain resilient, but the challenge will be whether spending trends can continue amid rising energy prices and ongoing uncertainty about economic growth and geopolitical developments.
Manufacturing activity in the U.S. softened a bit in June but remained firmly in expansion territory. The ISM Manufacturing Index fell from 54.0 in May to 53.3 in June, with weakness registered in the production and new orders sub-components. Employment strengthened last month, but the prices fell off a cliff.
Activity in the service sector also weakened modestly last month, with the ISM Services PMI declining from 54.5 in May to 54.0 in June. The employment gauge strengthened, while new orders, production, and prices all fell in June.
Eurozone May Need the Paddles to Revive Its Flattening Economy
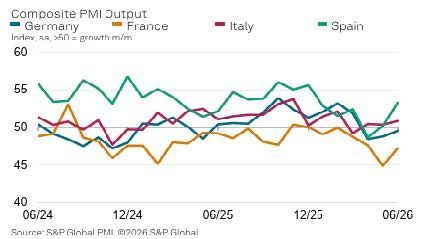
After two months of moderate declines in eurozone business activity in April and May, the latest S&P Global PMI survey data signaled a stabilization of the economy at the end of Q2.
The Composite PMI hit a 3 -month high of 50.0 in June, up from 48.5 in May.
While France and Germany remained in contraction territory, stronger expansions from Italy, Spain, and Ireland boosted overall business activity.
Service sector activity remained in contraction territory, but June saw increased activity, boosted by an expansion in employment.
The underlying data point to an economy that continues to struggle to achieve a sustainable level of growth.
Bring On More Chinese Stimulus (Taiwan & South Korea Continue EM Growth Lead)
China’s economy expanded by 4.3% in Q2, its weakest pace since Q4 2022. The weak print reinforced calls for more policy stimulus as an accelerating slide in investments deepened the strain on growth, while consumption remained subdued.
China’s Q2 growth came below the PBOC’s full -year growth target range of 4.5% to 5%.
Robust industrial production and exports tied to the global AI investment boom continue to power headline growth, but trends in private investment and consumption are a bit troubling and may require further support measures.
Exports remain the bright spot in an otherwise cooling economy.
Other key data showed retail sales rebounded 1% in June, and industrial output surged 5.3% Y/Y.
Many economists have raised their growth forecasts for South Korea over the past few months as the country continues to ride the wave of global AI spending.
Economists now expect 4% GDP growth for the current fiscal year, up from about 1% at the start of the year.
Taiwan has experienced a similar growth boom, primarily driven by a surge in semiconductor exports that fuels the AI infrastructure buildout.
Nature's Symphony
Source(s): S&P Global PMI
U.S. & EM EPS Are Nothing Short of Remarkable
As we embark on the Q2 earnings season in the U.S., expectations are high after the S&P 500 posted ~29% annualized growth in Q1.
The expectation for Q2 is 24.7%, with revenues forecast to grow by 12.8%. Energy (+125%), technology (+63%), and materials (+35%) are projected to see the highest earnings growth in Q2, while healthcare ( -18%) is the only sector expected to report a decline. Earnings are forecast to grow north of 20% in Q3 and Q4, with full-year calendar 2026 growth projected to be ~25%.
One notable point is that, despite the very strong earnings environment this year, growth is still expected to be 18% in 2027. We entered 2026 with the S&P 500 trading at a forward P/E of 22x, which has since fallen to 20.3x due to strong earnings growth.
These remarkable earnings growth figures compare to 17% growth expected in the MSCI EAFE Index and 65% growth projected in the MSCI EM Index.
Most of the EM growth is coming from just a handful of AI memory-related names from Taiwan and South Korea.
Will the Environment for Active Management Improve Anytime Soon?
The past year has been brutal for active management in traditional long-only equity strategies and for certain fundamental long/short equity funds.
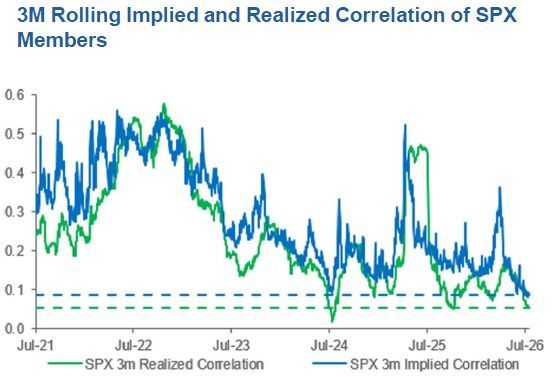
Correlations were elevated due to geopolitical/macro events, and dispersion was lower than historical averages. Although we do not recommend active management in certain more efficient asset classes, it is important to note that the environment has improved over the past 2 -3 months. 3-month implied and realized correlations have fallen to multi-year lows, and sector-level dispersion has increased amid violent market rotations.
In a perfect investing world, the combination of low correlation and high dispersion typically presents a good backdrop for active management. One issue is the alarming underperformance by many active managers, perhaps at levels that are impossible to recover from over time.
Retail Running for the Exits While Institutions See a Buying Opportunity
Following Q1 gating and negative headlines, retail-vehicle redemptions accelerated across the industry in Q2.
Certain BDC/interval funds reported Q/Q declines, while others reported Q/Q increases. Redemptions have been driven largely by retail investors along with some very large foreign investors.
Institutional investors remain bullish on the asset class, with many seeing the rotation of retail capital out of it at a discount as a buying opportunity.
Market Review
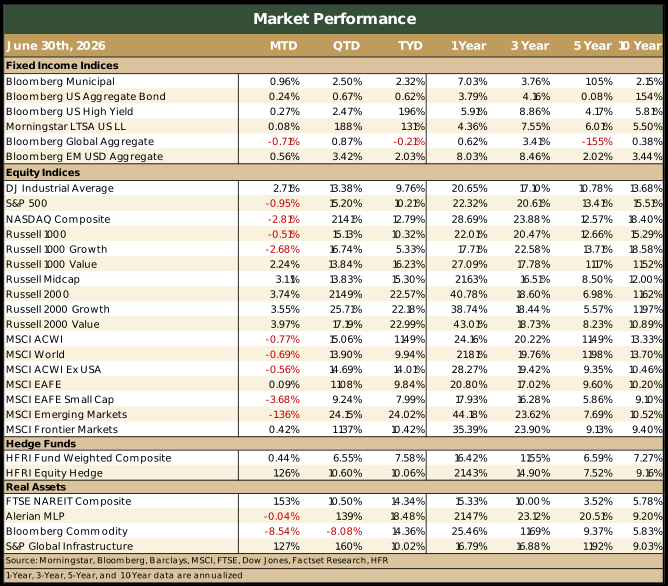
- U.S. equities were a mixed bag last month, with gains in small caps and losses in large caps, particularly the Mag 7 stocks.
- Value beat growth across all market caps, and small caps outpaced large caps.
- Many of the Mag 7 stocks have struggled a bit this year, allowing for a positive broadening out of equity markets.
- EAFE equities posted slight gains in June, led by beaten-down value stocks.
- Small caps underperformed large caps outside the U.S. and, in general, value beat growth.
- The strong USD cost EAFE investors 231 bps of performance in June and EM investors 133 bps.
- Interest rate volatility subsided a bit in June, which was positive for core fixed income and Muni bonds, which generally benefited from lower rates.
- It was generally another month of clipping coupons in credit markets, as tight spreads may limit total return potential.
- Bonds outside the U.S. faced headwinds from a stronger USD, which ultimately hurt returns.
- Hedge funds broadly gained ground in June, with the best-performing strategies being equity long/short and event-driven. Macro was particularly weak last month, and relative value funds posted a modest gain.
- Real assets were a mixed bag last month, with gains in real estate and listed infrastructure and losses in commodities and MLPs.
Note: For informational purposes only. Not an investment recommendation. The views expressed are those of Meramec Financial Planners LLC's advisory representatives as of the date of this newsletter. Opinions and any forward-looking statements expressed in this newsletter are subject to change without notice and are not guarantees of future performance. Historical performance figures for the indices are provided for illustrative purposes only and do not represent any actual investments. Index performance assumes reinvestment of distributions. The Indices are unmanaged, and you cannot invest directly in an index. Past performance is no guarantee of future results. Diversification does not assure or guarantee better performance and cannot eliminate the risk of investment losses.