Cross Currents | Keeping Connected
August 14, 2026
Every economic signal this month seems to be arguing with another. The U.S. labor market quietly buckled in July — payrolls fell instead of growing, and steep downward revisions to May and June dragged the 12 -month hiring average to just 34,000, even as consumers kept spending, and GDP, while missing forecasts, showed the underlying economy holding up better than the headline suggested.
Europe split down the middle too, with the eurozone as a whole beating growth expectations while its two anchor economies, Germany and France, continued to tread water. Asia diverged further still: China's factories slipped back into contraction just as Taiwan and South Korea rode a semiconductor and AI export boom to double -digit growth.
Markets registered all of this by doing something they hadn't in a while — rotating hard out of the AI-fueled growth trade and into value, with value trouncing growth across every market cap in July, even as hyperscalers kept pouring record sums into capex, increasingly financed by debt rather than cash flow.
And yet, for all the crosscurrents, 2026 remains a year in which almost every asset class — from real assets to high yield to international equities — has found a way to add value.
Staying connected to what's actually driving markets, rather than to the week's headlines, has never mattered more.
Solid Economic Growth Driven by No-Hiring/Firing Labor Market Environment
• The U.S. economy unexpectedly lost 23,000 jobs in July, well below the forecast of 83,000. In addition to the weak numbers for
June and July, the final count for May was revised down to 63,000, or 66,000 lower than the prior estimate. The revised numbers brought the 12-month average down to just 34,000. The unemployment rate slipped to 4.1% as the labor force participation rate fell further to 61.4%, its lowest in more than five years, another indication that fewer Americans were working or looking for jobs.
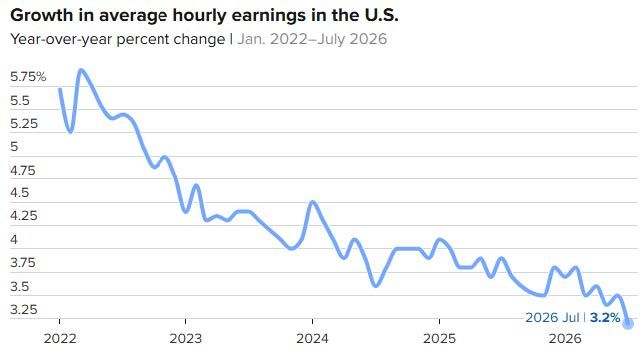
The July decline was led by a 50,000 decrease in local government positions and a loss of 19,000 retail jobs. Average hourly earnings were weak last month, with the annual rate falling to 3.2%, the lowest reading since May 2021.
• U.S. GDP growth of 1.5% in Q2 was below the 1.8% expectation and the 2.1% annualized rate reported in Q1. While the GDP number was below expectations, the miss appeared to stem from declines in federal government spending and inventories. Other parts of the economy appeared strong. Personal spending rose 2.1% after eking out a 0.4% gain in Q1. However, inventories fell 0.7%, and federal spending was off 0.3%.
Nature's Symphony
Source(s): U.S Bureau of Labor Statistics
Volatile Inflation Remains Above the Fed's Target
Consumer prices rose 3.5% annually in June, less than expected, as energy prices eased to near pre -war levels. The June CPI report showed headline inflation fell 0.4% M/M but rose 3.5% Y/Y, while core CPI was flat M/M but increased at an annual clip of 2.6%.
The easing of prices came from a big decline in energy and a decrease in service costs, particularly for housing. Energy declined 5.7% M/M but has still gained more than 15% Y/Y. Food prices jumped 0.2% in June, and shelter costs increased just 0.1%.
The Fed's preferred inflation gauge, the PCE Index, showed headline inflation of 3.7% Y/Y in June, with core PCE at 3.3% Y/Y.
Eurozone GDP Growth Beats Expectations; Germany & France Exhibit Continued Weakness
Eurozone economic growth beat expectations, but growth by member countries was all over the map. Growth of 0.4% Q/Q was better than the 0.2% estimate and the flattish growth reported last quarter.
Ireland reported the strongest level of growth at 3.9% Q/Q, while Germany and France both reported subdued growth of 0.2%. Germany's growth slowed from Q1, and France remained weak overall.
The eurozone flash composite PMI returned to expansion territory in July, hitting a 5 -month high reading of 51.9 (up from 50.0 in June). The increase in output reflected both a renewed rise in services business activity and a faster expansion in manufacturing production.
The solid growth in manufacturing output seen in July was the sharpest since March 2022. The eurozone's largest economy, Germany, saw business activity increase for the first time in four months. Meanwhile, French output continued to fall, but only marginally.
The latest data suggest the eurozone growth of about 0.3% Q/Q in Q3, but geopolitical uncertainty may continue to provide a headwind.
European Earnings Boosted by Surging Energy
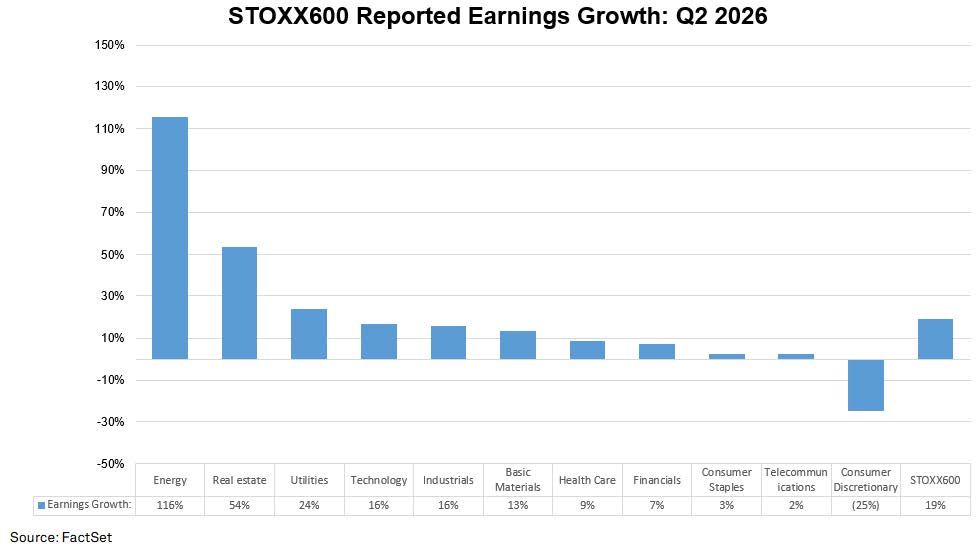
With 74% of companies in the STOXX Europe 600 having reported their Q2 results, FactSet data show aggregate earnings growth of 19.1% and revenue growth of 7.8%. The Q2 results are the best since Q3 2022. Energy has emerged as the clear standout, posting reported
EPS growth of 116% against a sales increase of 36%. At the other end, Consumer Discretionary has reported a 25% decline in earnings alongside a 1% decline in sales.
Expectations are high, so companies missing results have been punished by investors, while those beating expectations have seen fairly muted reactions.
Nature's Symphony
Source(s): GAO
Manufacturing & Services Appear Weak in China; Taiwan, & South Korea Continue To Benefit From AI
• China's official manufacturing PMI fell back into contraction territory, largely due to a slump in domestic demand and typhoon -related production disruptions. The official reading came in at 49.2 in July, down from 50.3 in June.
The headline figure was dragged down by the new orders subindex, which fell to 48.5, the lowest in 38 months. The RatingDog China Manufacturing PMI declined to a four -month low of 50.9 in July 2026 from 51.7 in June, as output and new orders grew more slowly.
China's official Non -Manufacturing PMI fell to 49.0 in July 2026 from 50.2 in June, pointing to a renewed contraction after two months of expansion. Business activity, new orders, and employment all weakened.
• South Korea's economy grew faster than expectations in Q2, driven by a semiconductor export boom powering AI and digital infrastructure. GDP rose 0.6% Q/Q or 3.7% Y/Y. Growth was driven by a 1.4% gain in exports.
Taiwan saw its third straight quarter of double-digit economic growth, with an annualized reading of 12.9% in Q2. Exports were strong, but domestic demand also provided a strong boost in Q2.
Are We Past the "Point of No Return" on the U.S Debt Bomb?
The U.S. Treasury has to roll over $6T of debt every three months in an increasingly skeptical market, while also issuing $2T of new debt annually to cover the worst structural deficit in U.S. peacetime history.
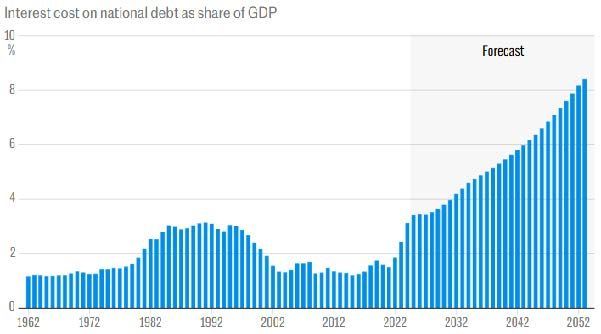
Treasury Secretary Scott Bessent has been concentrating ever more borrowing on short -term bills. This is a way to keep a lid on the spiraling interest cost of the U.S. national debt, which has quadrupled to $1T over the past decade.
Interest on the national debt now exceeds the U.S. defense budget and is fast heading towards 4% of GDP. While external players have pulled back from Treasury purchases, the void has been filled by levered hedge funds seeking arbitrage opportunities.
How Big a Risk Is the Surge in Hyperscaler Capex Spending on Financial Markets
• U.S. investors have grown accustomed to a significant market tailwind from corporate share buybacks. The massive amount of capital needed for the AI/digital infrastructure buildout in the U.S. has led many of the highest-quality technology companies to shift from share repurchases and incredible cash flow generation to higher capex and equity and debt issuance.
The tailwind from share buybacks has not disappeared, but it remains an unlikely backstop for the main hyperscalers.
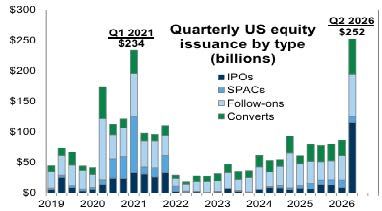
• U.S. corporations raised $252B of equity in Q2, eclipsing the previous quarterly record of $234B set in Q1 2021. Economists expect hyperscaler capex spending of $1.1T in 2027, $150B more than the total operating cash flow from the underlying companies.
Economists project that 35% of that capex will be financed through debt. $1.4T in share buybacks are still forecast for the S&P 500 this year, despite the pullback by hyperscalers.
We believe some investors have grown uncomfortable with this significant shift away from cash flow generation towards higher capex spending and debt issuance.
Market Review
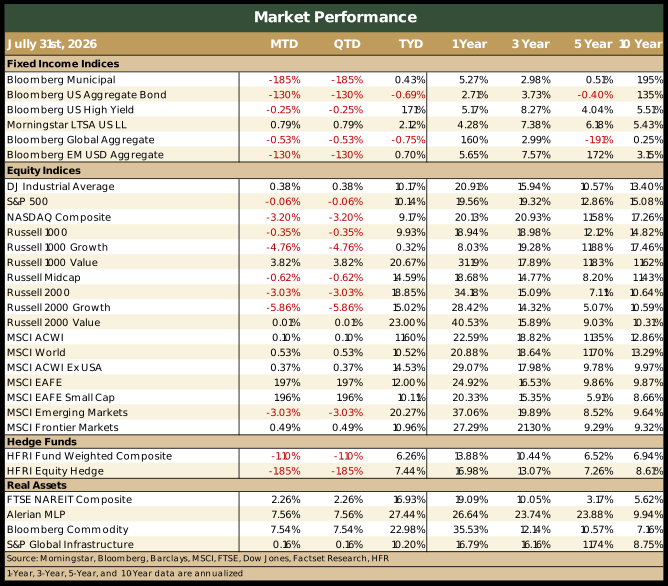
- U.S. equities were mostly negative in July, led by the selloff in growth/tech stocks leveraged to the AI buildout trade.
- Value trounced growth stocks across all market capitalizations, and large caps provided some protection against small caps.
- Earnings have been exceptional, and we are encouraged by the broadening of markets in recent months.
- EAFE equities outperformed in July, as the universe is heavily weighted toward value stocks. Within EAFE markets, value beat growth, and there was little dispersion between large caps and small caps.
- EM equities struggled largely due to the unwinding of the AI trade.
- USD weakness added 103 bps to EAFE returns and 123 bps to EM returns.
- Interest rates and Treasury yields continued their march higher in July, resulting in losses across most areas of fixed income.
- Core fixed income and municipal bonds shed ground in July. Credit was mostly negative during July, driven primarily by spread widening and the overall move higher in rates.
- Floating-rate loans eked out a small gain, providing some insulation against higher interest rates.
- Hedge funds broadly shed 1.1% last month with weakness from equity L/S, event-driven, and macro strategies. Relative value eked out a small gain. Most of the losses were leveraged to the violent AI trade unwind in July.
- Real assets were positive across the board in July, led by gains in commodities and MLPs. Listed infrastructure and REITs also posted solid positive returns.
Note: For informational purposes only. Not an investment recommendation. The views expressed are those of Meramec Financial Planners LLC's advisory representatives as of the date of this newsletter. Opinions and any forward-looking statements expressed in this newsletter are subject to change without notice and are not guarantees of future performance. Historical performance figures for the indices are provided for illustrative purposes only and do not represent any actual investments. Index performance assumes reinvestment of distributions. The Indices are unmanaged, and you cannot invest directly in an index. Past performance is no guarantee of future results. Diversification does not assure or guarantee better performance and cannot eliminate the risk of investment losses.