AI Hallucinations | Keeping Connected
November 14, 2026
Despite the strong AI-driven economic backdrop, a sharp AI-led market sell-off has wiped trillions of dollars in value from major tech stocks as political shifts and data center scrutiny have rattled investors.
The U.S. Economic Backdrop Remains Quite Strong & Resilient
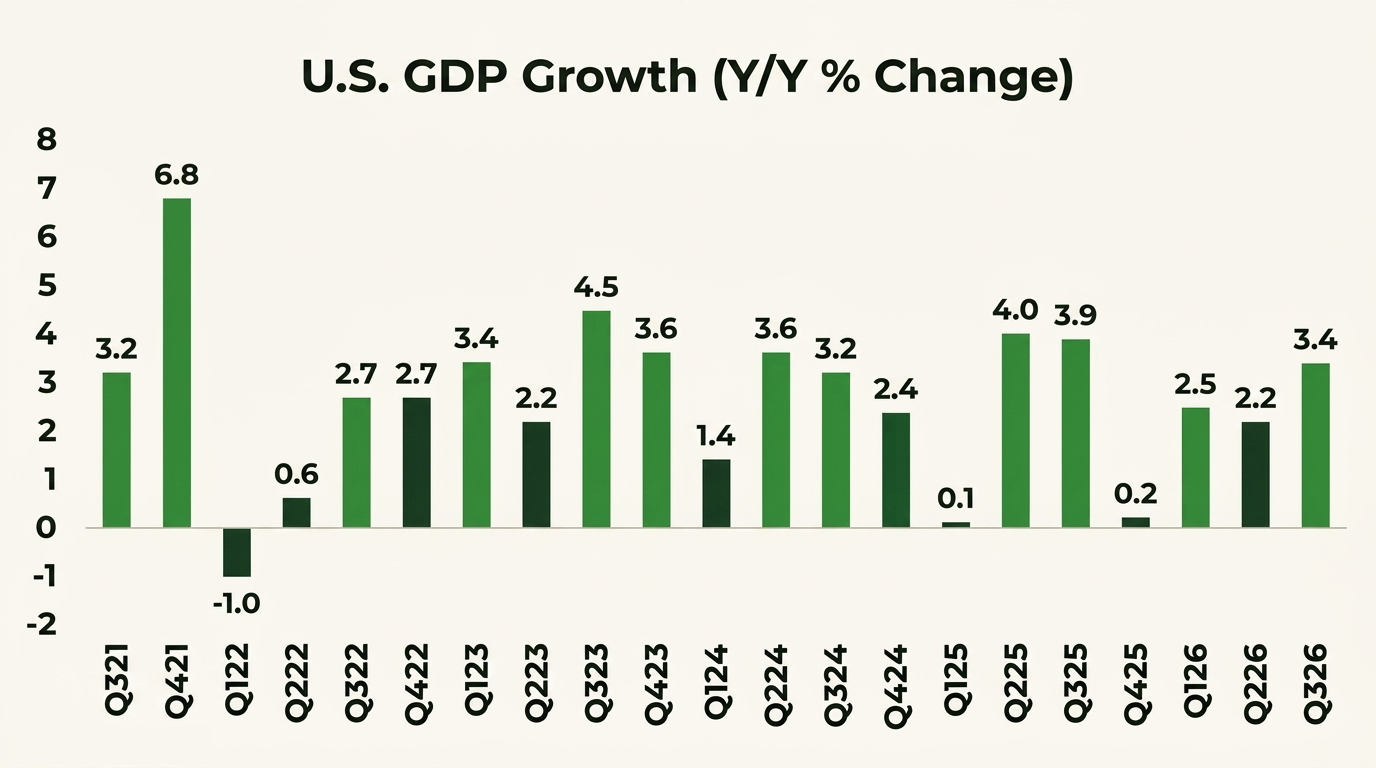
• The U.S. economy grew 3.4% in Q3 based on the advance reading from the Commerce Department. This marked a significant increase from the 2.2% growth rate reported in Q2 and the 2.5% rate reported during Q1. Economic growth has been driven by higher investment in the artificial intelligence build-out, as well as by high levels of consumer and government spending.
Consumer spending rose 3.8% in Q3, at the same pace as the prior quarter. Gross private domestic investment soared 19.4%, driven by a 20.9% surge in equipment spending and an 8.4% jump in intellectual property products. Real sales to private domestic purchasers, a proxy that Fed officials use for underlying demand, rose 4.9%, compared with a 4.6% increase in Q2.
• U.S. consumer prices rose more than expected in October. CPI increased 0.4% M/M last month, and core CPI rose 0.3%. Both readings were 0.1% ahead of expectations, and no annualized rates were available due to the October 2025 government shutdown. This was a "hotter" reading, and the chance of a December interest rate hike stands at 100%.
Gas prices rose 0.7%, food prices surged 0.5%, and shelter costs rose 0.3%. Markets are now actually pricing in either a 50-bps rate hike in December or back-to-back rate hikes in December and January.
• Employers in the U.S. added 165,00 new jobs to the economy during October, well above expectations, and the unemployment rate fell to 4.1%. An additional 84,000 new jobs were added to the August and September reports. Job gains came in professional and business services, healthcare, and manufacturing. Finally, the broader U6 unemployment rate jumped 0.3% to 7.9%
• The U.S. manufacturing sector saw an uptick in business activity during October based on the latest ISM Manufacturing PMI.
The headline reading of 55.5 in October was up from 54.5 in September, with strength coming from production and new orders.
The gauges of employment and prices softened slightly last month. The ISM Services PMI remained strong in October, but the pace of activity weakened a bit due to softness in new orders and production.
Nature's Symphony
Source(s): U.S Bureau of Economic Analysis
Eurozone & Japan Battling Combination of Anemic Growth & Higher Inflation
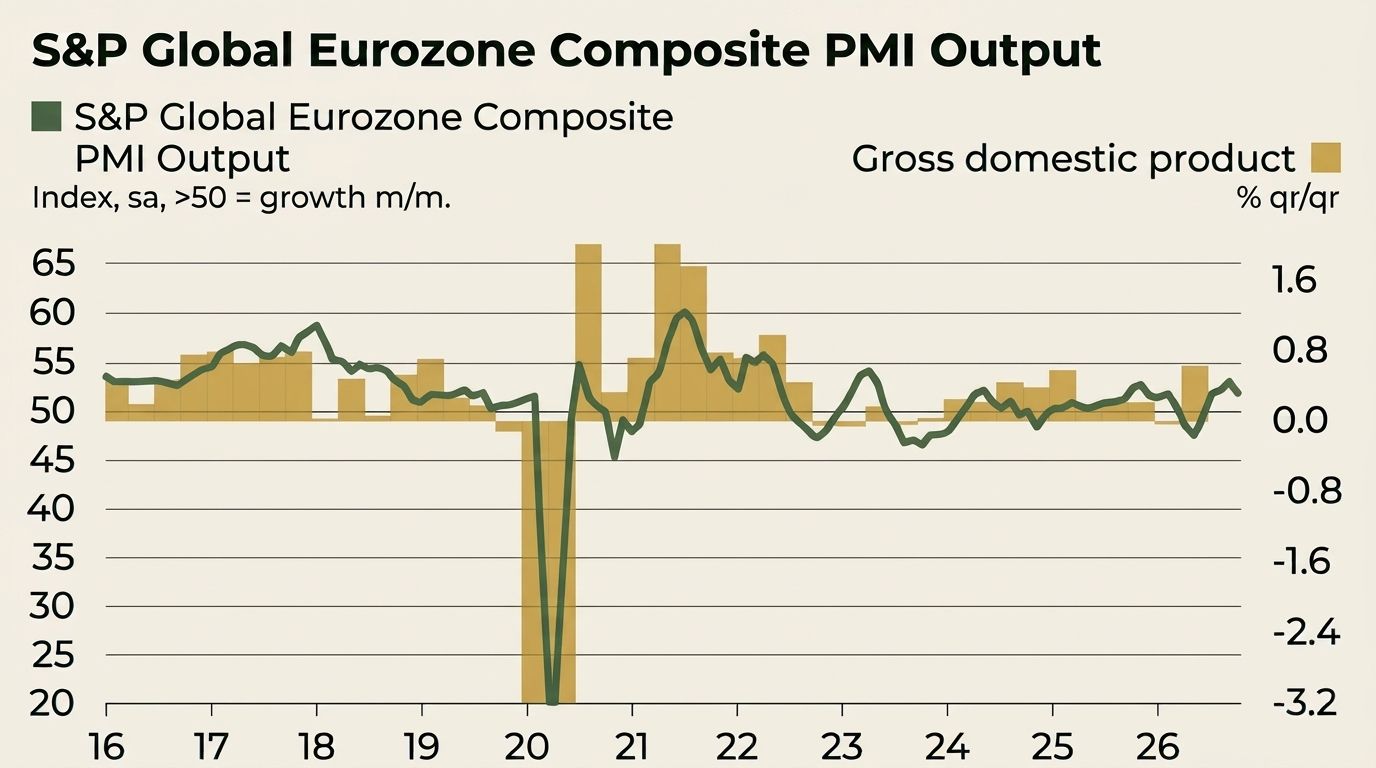
• The eurozone grew 0.4% Q/Q in Q3, down from 0.6% in the prior quarter. France contracted by 0.1%, while Germany grew by 0.2%. After hitting a 41-month high in September, the eurozone flash composite PMI eased slightly in October.
The headline PMI fell from 53.1 in September to 51.9 in October, driven by modest softening in both manufacturing and services. Output and new orders both increased for the fourth successive month in October, but at slower rates. Weaker growth was evident in both the manufacturing and services sectors.
French private sector output moved back into contraction in October, following its first rise in 10 months in September. Meanwhile, Germany and the rest of the eurozone continued to record growth in activity, albeit at easing rates of expansion. A key drag on growth was a renewed decline in business activity in the French services sector.
Overall, this PMI report is consistent with quarterly GDP growth of about 0.3%.
• Even Japan is dealing with the prospects of higher inflation after years of dealing with persistent deflation. Headline CPI rose 2.1% Y/Y in September or 2.4% when excluding energy and fresh food. The increase appeared to be driven by price hikes in durable goods and public utilities charges.
With inflation now sitting above the BOJ's 2% target, additional rate hikes may be necessary after hiking 25 bps (to 1.25%) in September to the highest level in 30+ years. This all comes on the heels of 0.4% Q/Q GDP growth in Q2.
EMS AI-Leveraged Growth Shines (But Beware of All the Potential Risks).
• China's economic growth accelerated to 4.5% in the third quarter, picking up from a three-year low of 4.3% in Q2. Exports and demand for technological equipment drove growth acceleration in Q3, but this was offset by continued weakness in domestic demand.
In September, retail sales eked out 1.1% growth, exceeding the forecast of 0.6%, while industrial output grew 5.5% Y/Y, in line with the forecast. The urban unemployment rate stood at 5.2% in September. Fixed asset investment in urban areas has declined 7.2% Y/Y for the first 9 months of 2026.
Producer prices in China climbed at their fastest pace in over four years, rising 5% in September, while consumer inflation remains below 1%, reflecting persistent excess capacity and weak demand that are constraining businesses' pricing power.
• South Korea grew 1% Q/Q in Q3 or 3.4% on an annualized basis, ahead of consensus expectations. Exports and semiconductor investments accounted for more than half of the quarter's growth, while private consumption fell for the first time in 4 years.
• We like to remind investors of the higher geopolitical risks associated with investing in emerging markets. Geopolitical risks are always lurking, and that was front and center last month with the shock outcome from the Brazil elections. Luis Inácio Lula da Silva's surprise re-election as Brazil's president prompted a sharp market reaction, with stocks falling 14%.
Bond yields rose, and the Brazilian real sold off 8% versus the USD. Lula was seen as less market-friendly than his competitor, Flavio Bolsonaro.
Nature's Symphony
Source(s): FactSet
Corporate Earnings Remain Fantastic, While Private Market Exits Face Continued Challenges
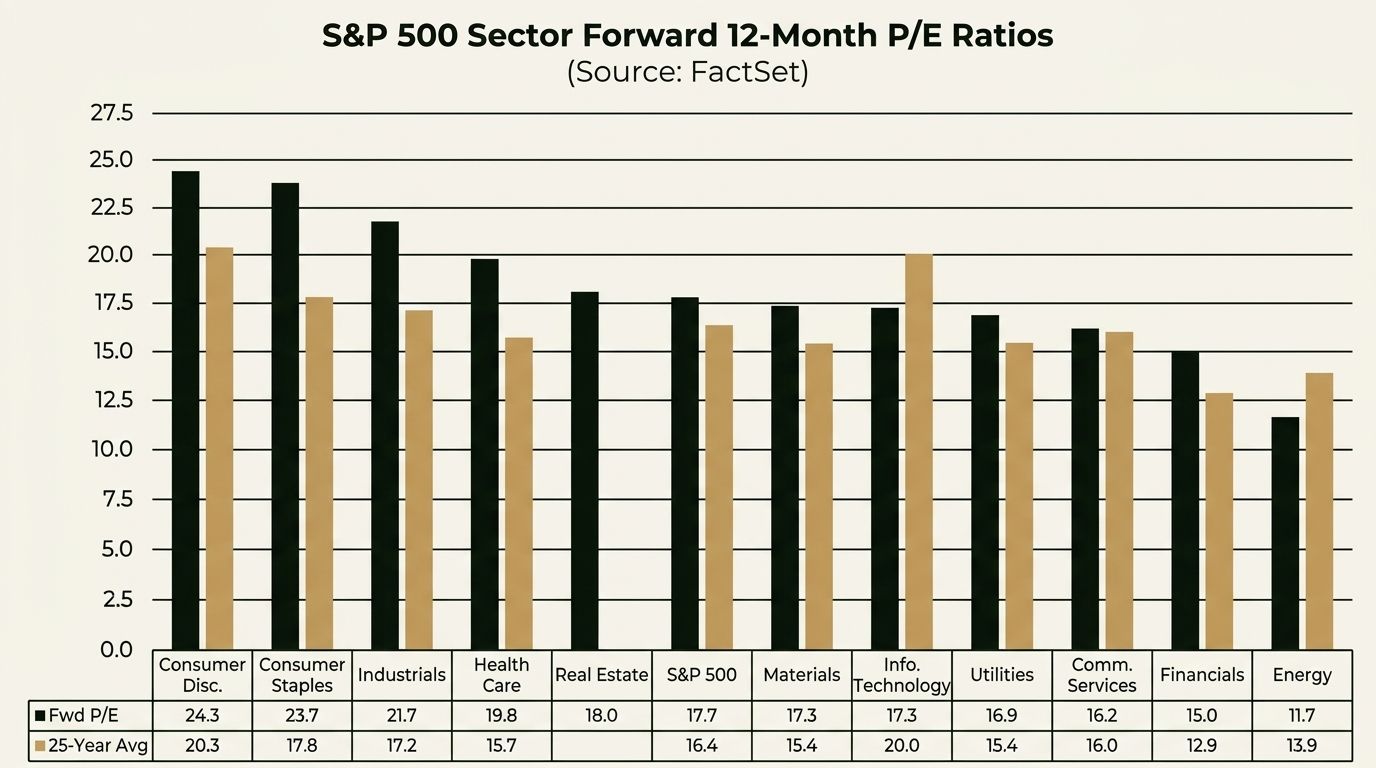
• 88% of the S&P 500 has reported Q3 earnings and the numbers are once again fantastic! 31.4% earnings growth is in line with estimates and will mark the third straight quarter of 25%+ growth. Analysts expect 33% growth in 2026, driven by the energy and Al/tech sectors. Earnings are forecast to grow 16% in 2027. Strong earnings continue to make valuations look more attractive, with the S&P 500 now trading below 18x forward.
• The exit environment for PE/VC has been quite challenging over the past few years, with extended hold times, increased secondary activity, and muted distributions. Since 2001, the average annual distribution rate for PE and VC funds has been 24% and 14%, respectively. According to Pitchbook, distributions for PE and VC were only 13% and 5%, respectively, in Q1. Distributions continue to run well below historical averages.
Market Review
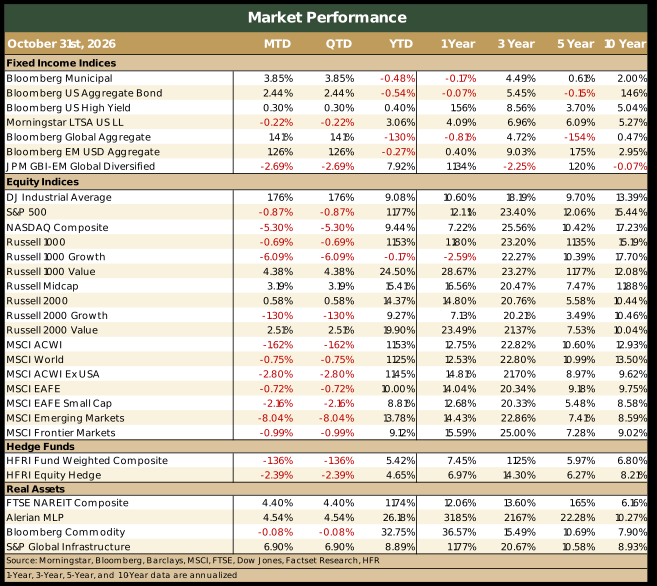
- U.S. equities were a mixed bag in October, with strength in value stocks and small caps and broad weakness in the tech/AI trade.
- Small caps outperformed large caps last month, and value stocks sharply outperformed growth stocks.
- Equities outside the U.S. exhibited broad weakness in October, fueled by softness in Asia and emerging markets.
- Small caps underperformed large caps last month, and value stocks outpaced growth stocks.
- USD strength cost EAFE investors 28 bps last month and EM investors 60 bps
- Interest rates finally fell in October after moving sharply higher for most of Q3. The October decline was positive for core fixed income and municipal bonds.
- Credit largely gained ground last month on the heels of falling interest rates and tighter spreads. Floating rate loans were the lone exception.
- The strong U.S. dollar acted as a headwind for non- U.S. assets.
- Hedge funds fell last month as more equity-sensitive strategies posted losses.
- Real assets gained in October, fueled by lower interest rates and steady energy demand.
Note: For informational purposes only. Not an investment recommendation. The views expressed are those of Meramec Financial Planners LLC's advisory representatives as of the date of this newsletter. Opinions and any forward-looking statements expressed in this newsletter are subject to change without notice and are not guarantees of future performance. Historical performance figures for the indices are provided for illustrative purposes only and do not represent any actual investments. Index performance assumes reinvestment of distributions. The Indices are unmanaged, and you cannot invest directly in an index. Past performance is no guarantee of future results. Diversification does not assure or guarantee better performance and cannot eliminate the risk of investment losses.